ShowTheBestCase-Based Reasoning |
and Documentation |
ShowTheBest allows your users to score database records based on value and importance. Your user selects an "importance factor" for each field and a value or criteria for each field. Depending on your customization, importance factors can be numbers (like 2.5) entered from an input widget or text chosen from a selection widget (like "Very Important"). Similarly, values can be factors can be numbers (100) or text ("14th Street") entered from an input widget or text chosen from a selection widget (like "Downtown" or "Lowest Cost"). For each field in the database, ShowTheBest compares your user's chosen values to those in the database; for each record, each field is scored and the then multiplied by the importance factors already selected. The resultant "weighted average" is normalized to a score that is between 0 and 100. (All intermediate field scores can be shown in the ShowTheBest Server Version: just invoke the ShowTheBest Control Tool and check the "Display Intermediate Field Scores" checkbox.)
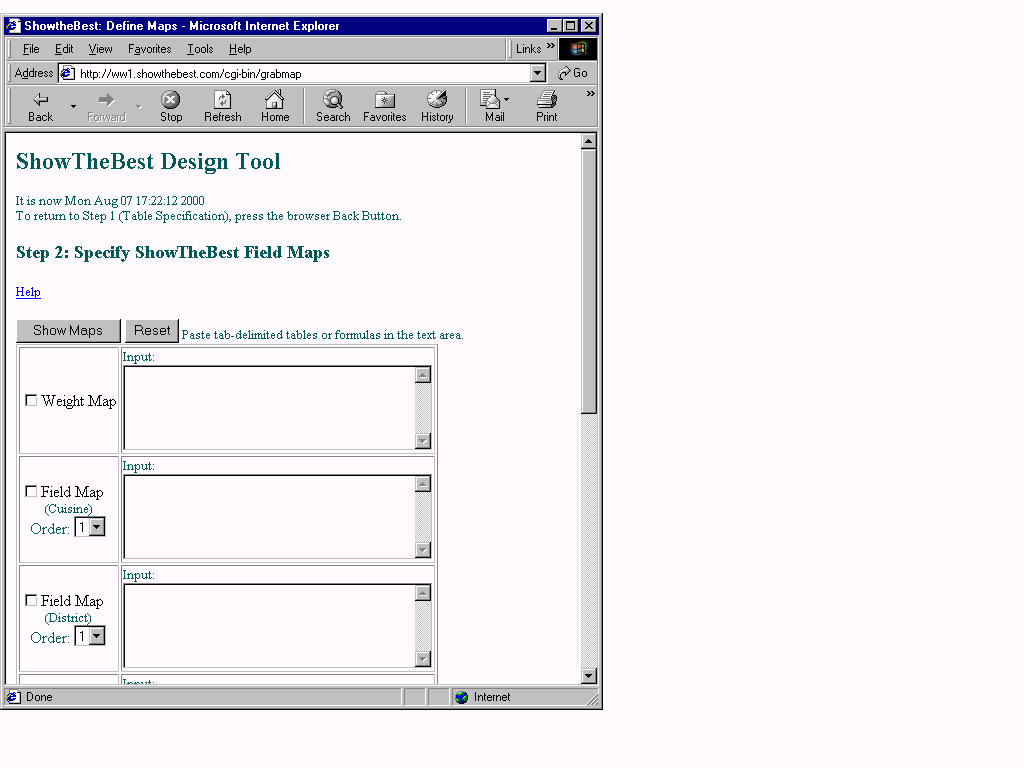
Maps provide a way for ShowTheBest to represent user inputs as HTML input or choice selection widgets. Maps specify how the data in each field are to be matched. The Map Specification page looks like this:

Note that in this form there is a sequence of check boxes and text area boxes for the Weight Map and for the Field Map corresponding to each field in the database. Like the Case Database, maps are specified with tab-delimited text. For the sample application, here are the maps in Excel format.
(The ShowTheBest development tool also lets you choose if you want to display (i) both Weight and Value Widgets, (ii) Value Widgets only, (iii) Weight Widgets only, and (iv) no widgets. This last option is useful if you want to create your own widgets in HTML or Java that calls the ShowTheBest CGI program directly.)

ShowTheBest will create an Input Box representation for the Importance section of the Interactive Table:

Note that the default initial values for the weights are 1. The Server Version of the ShowTheBest development tool provides a way to initialize the weights: just invoke the ShowTheBest Initializing Tool and select the form weights and values to what you require.
If you want your user to input the "degree of importance" by a Selection-style choice box, then (1) check the Weight Map Check Box, (2) create a 2-column tab delimited table with any editor and (3) paste it in the Map Form. The first column should contain text, and the second column should contain a "relative equivalence" -- any positive number that reflects a relative magnitude of importance. You can copy and paste the tab-delimited table just like you did with the database table (discussed above) -- using Excel or any other tool.
Here is an example. This Weight Map specification...
...creates the following Selection-style choice widgets for every field in the Interactive Table:

Note that in this case, the default initial values for the weights are the first choices in the Map.
(Note that
ShowTheBest.Com -- the version of ShowTheBest that runs on your server -- provides a tool that initialize weights and values.)
A Field Map is used to specify your user's field values and criteria. The field map will be used to match the values of that particular field against for all records in the database table. If you do not want your user to specify any value for a field, then leave its Field Map Box unchecked. ShowTheBest will treat any unchecked field as an Information Field -- its values will not be used by the scoring engine and no Importance or Value widgets will appear for the field.
If you want your user to explicitly specify a value
for a field, then check its Field Map
Check Box. If the text area is empty, ShowTheBest will create an
Input Box widget for the Value section of
the Interactive Table corresponding to the field. For example, if we check the Field Map Check Box for the field labeled
"District", ShowTheBest creates an input box widget for "District" field the
Interactive Table: Note that in the above display there is no entry for
Cuisine -- its field Map Box was not checked. The District field was checked
(with no map in the text area) so ShowTheBest represents it as an Input Box.
Also note that the default initial settings for the values are the values that
correspond to the first data record in the Table Database.
(Note that
ShowTheBest.Com -- the version of ShowTheBest that runs on your server -- provides a tool that initialize weights and values.)
Users can type anything into the input box: matches are "fuzzy."
ShowTheBest matches values by its type. Text values by substring: if
the input text is a substring of a database field entry or vice versa
then we have a match. "Wildcards" are allowed: the text "c*t+d*g" will
match "cat"; it will also match "caveat" and will also match "dawg".
Numerical quantities are matched via a relative strength heuristic: the
match is the ratio of the minimum value to the maximum value. ShowTheBest
will always try to compare text with text and numbers with numbers: if there
is an inconsistency then the ShowTheBest match will result in a zero. If you want your user to input the field value or criteria
by a Selection-style choice, then check the field Map Box and
paste a 1- or 2-column tab delimited table in the Input Form.
The first column should contain text; if there is a second column
it should contain a "relative equivalence" -- any positive number.
You can copy and paste the tab-delimited table just like you did with the
database table (discussed above) -- using Excel or any other tool. The first example shows a single column map -- called a "Synthetic Map"
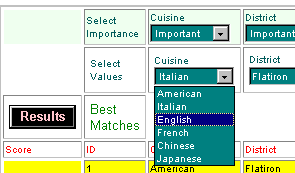
because ShowTheBest generates its own relative equivalences: This field Map Specification creates the following Selection-style
choice representation for the Interactive Table: The behavior of this map is that if your user chooses
"American" then ShowTheBest will match any substring containing
"American". Note that in this case the default initial settings for the
choice values are the values that correspond to the first choice in the
Map. The Server Version of the ShowTheBest development tool provides a way
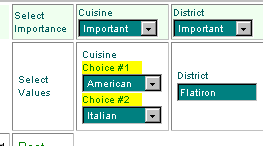
to initialize the weights to the other choices: just invoke the ShowTheBest Initializing Tool and select the form weights and values to what you require. Suppose you want your user to match against preferences: for example, suppose your user prefers, in order, first choice American and then second choice Italian cuisine. In ShowTheBest you represent this type of match by specifying an Order for the Field Map with the Order selection widget. For example, the following map specification for the Cuisine Field... ...creates the following Selection-style choice
representation for the Interactive Table: Database records with "American" will have a higher matching score
than "Italian" and the others not having these values as substrings will
not match. If you want to add more "fuzziness" to the match, you can create
a map with your own "relative equivalences." For example, the following
Field Map for cuisine has a second column for relative equivalences: This map specifies that the "distance" between
American and Italian cuisine is 0.5 (=1/2); the distance between American
and English cuisine is 0.33 (=1/3); the distance between American and
Chinese cuisine is 0.2 (=1/5), and so on. It also specifies that the
distance between French and English cuisine is 0.66 (=2/3); the distance
between Chinese and French cuisine is 0.8 (=4/5), and so on. So, if your
user wants to match on Italian, this map says that the next
closest cuisines are American and English. You should be careful
with these kinds of fuzzy matches. Another kind of map is specified by a formula. Here are examples
of two formula specifications...
...and their form representation for the Interactive Table: Formulas specify the result of an intermediate field score and should
evaluate to a number between 0 and 1 (inclusive). For example, the following
formula scores a 1 for those records that have a database value greater than
100:
Formulas can contain text as well. For example, the
following formula scores a 1 for those records that have a
database value greater than "George" when compared in alphabetical
order: Formulas can contain arithmetic and comparison operators.
For example, the following formula scores a number between 0 and 1 for those
records that are greater than 100 and less than 200: If the data value is equal to 200 than the score is 1; if it is equal to 100 then the score is 0.5. The following formula scores a 1 for those records that are either equal to "dog" or "cat": The operators that ShowTheBest uses comply with most spreadsheet operators. They are the familiar arithmetic operators for addition, subtraction, multiplication, and division (+, -, *, /); greater than, less than, greater than or equal to, less than or equal to (>, <, >=, <=); equal, not equal (=, <>). Note that + can be used for logical OR as well as for addition, and that * can be used for logical AND as well as for multiplication. Formulas can contain "variables." For example, the following formula scores a 1 for those records that have a database value greater than the value that the user chooses in the Values Section of the Interactive Table: The variables that ShowTheBest uses are: For data and values that evaluate to numbers, ShowTheBest has the following variables The first type of Field Map using formulas generates an
Input Box for the user. For example, this specification... For example, if your user types in 20.00, the intermediate scores in
the field will be 1 if the data values are less than or equal to 20.00
and 0 otherwise. If the user types in anything else (like a character
string) then the intermediate score will be zero. The second type of Field Map using formulas generates a
Selection-type choice box for the user.
In this case, the user decides which formula to use in the field.
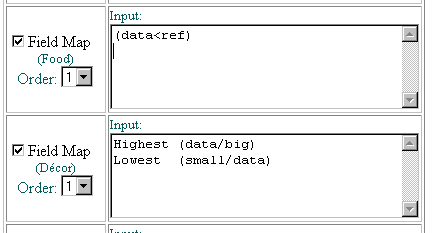
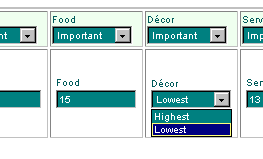
For example, this specification... ... creates the Selection-style choice representation for the
Decor field in the Interactive Table. When your user selects "Lowest", the intermediate scores
computed will be 1 if the data value is actually equal to the
lowest value in the field, and progressively smaller numbers if
the data value is greater than the lowest value. For example, if
the data value in the field is 1000, and the smallest value is 20,
then the intermediate score is 0.02 (=20/1000). Note that if your
user selects "Highest" than the scores will be different. Go through the sequence of check boxes and text area boxes for the
Weight Map and for the Field Map corresponding to each field in the
database. When you are done,
press Show Maps: ShowTheBest will determine
if the maps you specified are valid.
© 2002 Inductive Solutions, Inc. All Rights Reserved.
Field Maps




Formula Maps
(data >100)
(data >"George")
(data>100)*(data< =200)*(data/200)
(data="dog") + (data="cat")
(data >ref)
the database value in
the particular field
the value that the user chooses or selects
the smallest value in
the field (across all records)
the smallest value in the
field (across all records)
the average value in the
field (across all records)
the value (big-small) in the field (across all records)(data<ref)
...creates the Input Box representation for the Food field of the Interactive Table.
Highest	(data/big)
Lowest	(small/data)
Sample Problem
Sample CBR Application
Help